Creating a Photon Detector Scanning Device
Physics 150: Intro to Research final project with the help of Prof. David Stuart
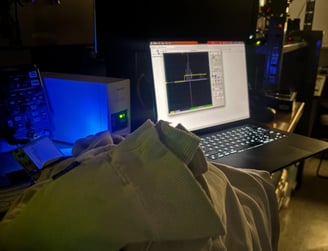
Phase 1: Create a light tight box and use a single photon detector to detect single photons generated by an led light blinking very dim.
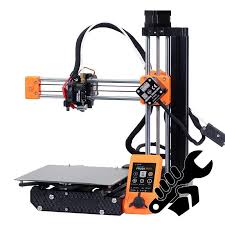
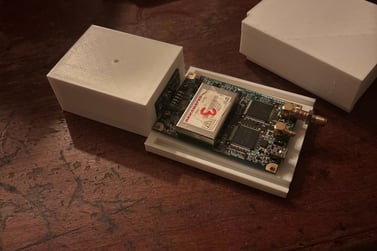
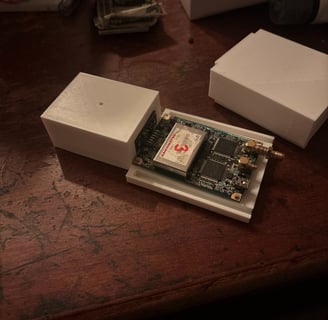
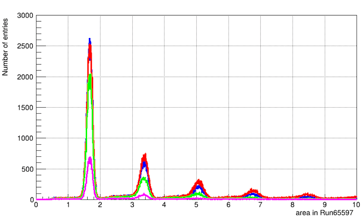
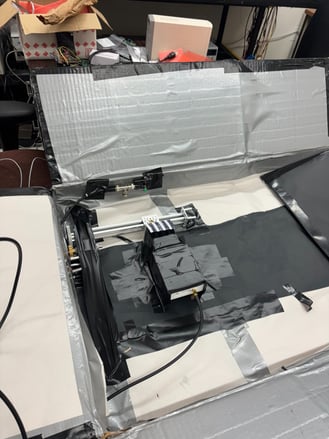
My first step here was creating this light tight box using CAD through multiple prototypes, until I created my final version, which is shown on the left. The photon detector goes into the box and is then taped around to ensure that no photons leak through. There is a 1.5 millimeter hole on the front side where the photons from the blinking LED are meant to come in, as the detector itself is only 1.5 millimeters. The graph shown is the photons detected in number groups, 1.5, 3.5, etc plotted against how many times that amount of photons was detected. For example, around 1.5 photons was detected 2000 times over my 400 m/s period. The different colors represent different voltages powering the LED through a waveform generator 3 V, 4 V, and 5 V. Where the pink represents the background photons to be subtracted for the final graph representation. The data that I gathered in this experiment was used to learn how to use an oscilloscope, waveform generator, single photon detector, and all of the software that I used to analyze the data and create graphs, so that I could move on to the next phase of this project.
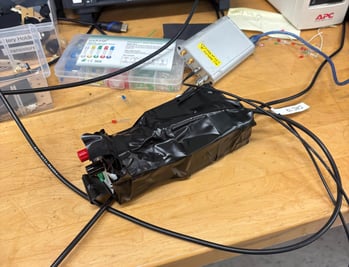

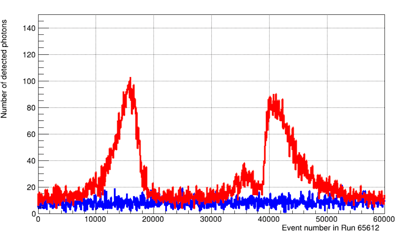
Phase 2: Use my light box that I developed in the previous experiment, and now plot single photons detected on a 1d plane from an LED blinking at a constant rate with a constant voltage, when a piece of blacked out paper is moved in front of the detector.
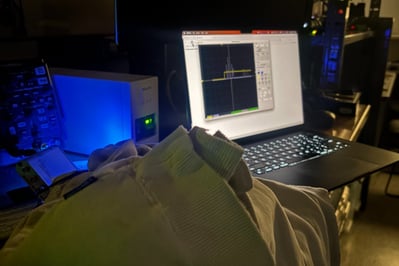
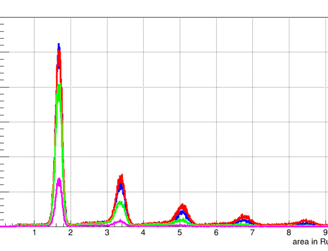
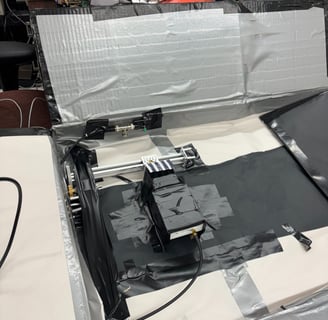
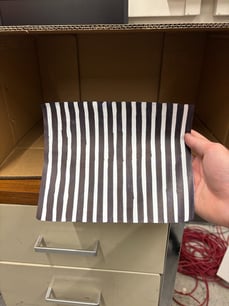
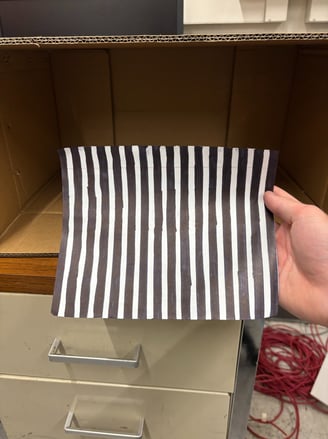
In order to do this I placed my light tight detector box with the detector inside, inside of another larger light tight cardboard box that was created to minimize the amount of photons that hit the detector from outside the LED light. Below is a larger prototype of the piece of paper that I used in front of the LED. Also, the graph shown below shows when the LED light is moved from black line to white, black, then to white again. This is shown with the spikes in the graph being the white, as more photons come in as opposed to black. In this experiment there is a lot of background photons that come from around the edges of the paper shown in the picture. This experiment shows the 1d representation of my experiment, and it is the stage that I am currently at.
Phase 3 (Final): Combine my previous two experiments to create a heat-map of a black and white picture on a 2D plane using a 3D printer.
I am currently in the process of designing this experiment and conducting it, although my current idea that I have is to have the detector pointed towards the ceiling, in a modified version of my light tight box. I plan on placing the led light about 5 cm above the detector and sandwiching my black and white picture in between. This will allow for the black ink in my picture to disrupt the photons coming through, so the detector and software can graph the representation. The 3D printer and surroundings will be made light tight, by creating a housing for the printer as well and shutting the lights off. This is my final experiment and I will be implementing the final results and design soon!